
Spatial Signal
Visitor Flow
Mapping movement patterns to understand where pressure concentrates and where capacity remains.

Mapping movement patterns to understand where pressure concentrates and where capacity remains.
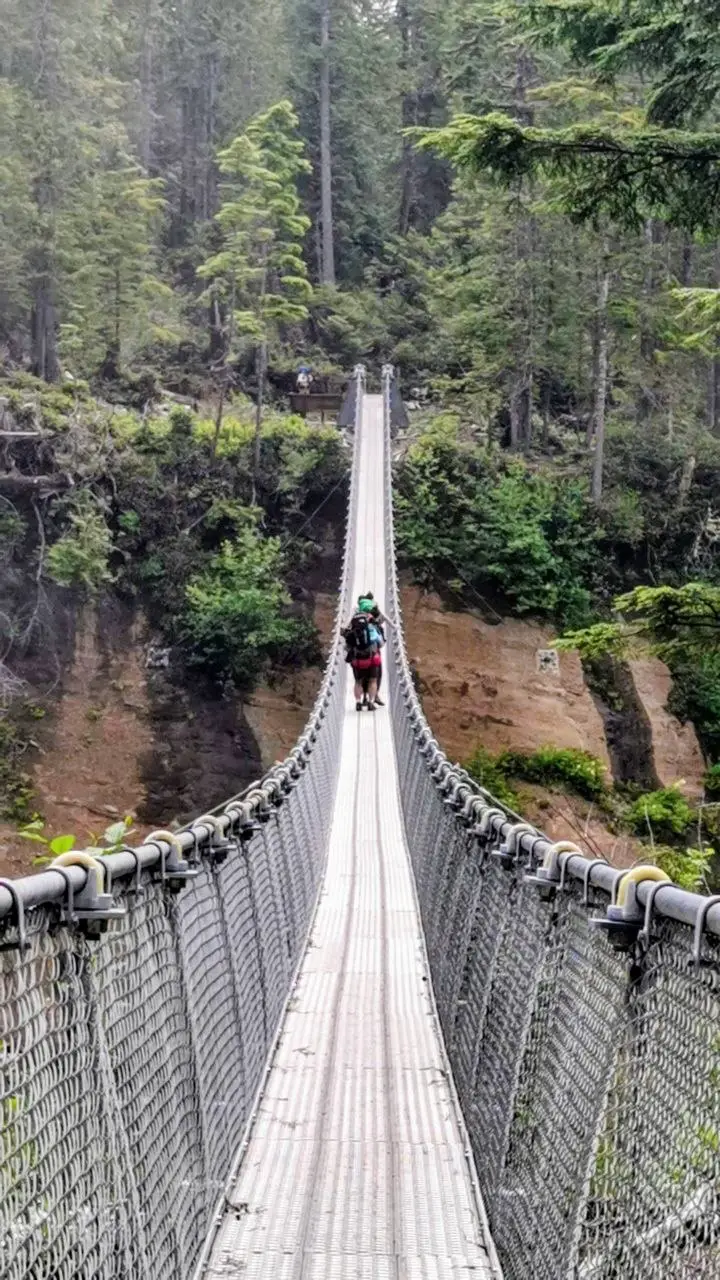
Identifying peak periods and seasonal shifts that impact infrastructure and community experience.

Examining visitor origins and relationships between digital behaviour and visitation patterns.
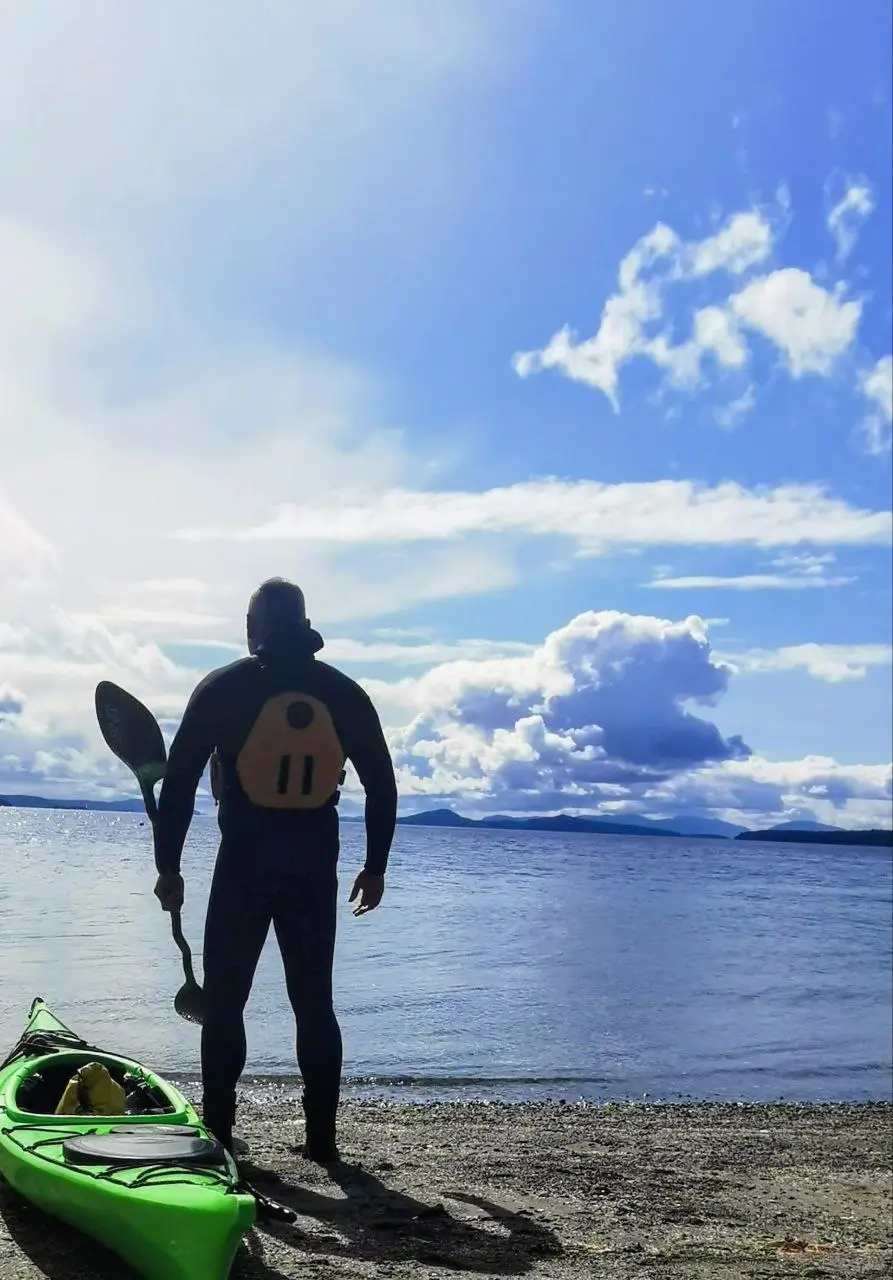
Connecting expenditure data to local employment and broader regional economic indicators.

Monitoring how changing conditions and campaigns alter demand across the four seasons.

Measuring resident attitudes and recreation use to balance tourism growth with local well-being.
"Trail use increased."
Who is using the trail, when, why, and under what conditions?
Is the pattern continuing, where is it concentrated, what other indicators are changing with it, and when should someone respond?
The current Destintel digital-data infrastructure includes the following capabilities. These can operate independently or as interconnected parts of a broader intelligence environment.
Dashboards are the interface. Intelligence is the system behind them. Relevant operational, tourism, and economic indicators are organized into an analytical environment that supports monitoring and decision-making. The visible chart is only the final layer — the more important work is deciding what belongs underneath it.
A destination rarely operates through one organization. Data hubs improve access to relevant information for authorized stakeholders and support coordination across municipalities, tourism organizations, businesses, recreation managers, and partners — reducing the distance between who has the information and who needs it to make a decision.
Not everything needs to be real time. Approved digital and sensor sources are integrated with configurable update frequencies where the operational need justifies it. The better question is not "can we make this real time?" but "how quickly would this information need to change before someone should make a different decision?"
Tourism and recreation decisions are often spatial. A total visitor count may appear manageable while a map reveals concentrated pressure. These platforms combine relevant tourism and recreation information with spatial interfaces that allow users to explore geographic relationships more directly.
Sometimes the information an organization wants simply does not exist yet. Mobile-friendly research and field-data workflows move through Design → Deploy → Capture → Integrate → Analyze, so newly collected information becomes useful within the wider evidence environment.
Systems should talk to each other. Integration supports data exchange between CMS, CRM, mobility sources, sensors, web analytics, survey platforms, and internal databases — creating a stronger foundation for monitoring, reporting, analysis, and automation.
Connecting data creates responsibility. Cloud-based deployment and governance practices address access, permissions, privacy, licensing, quality, retention, security, and ownership — so information is easier to use without making responsible information management harder.
Suppose a research project identifies an important visitor pattern. The organization now understands the issue. Research reveals the pattern, intelligence helps organizations continue watching it.